
Highlights for Q1 FY 2026-27
- Net Profit surges to ₹2,115 Crore for Q1 of FY 27 registering a YoY growth of 5%, and QoQ growth of 9%.
- Net Interest Income (NII) stood at ₹3,486 Cr, YoY growth of 10%.
- Total business stood at ₹5,84,725 Cr, YoY growth of 15%.
- Total Deposits stood at ₹3,25,757 Cr, YoY growth of 10%.
- Net Advances stood at ₹2,58,968 Cr, YoY growth of 22%.
- CASA stood at ₹1,42,162 Cr, YoY up by 7%.
- Gross NPA down to 2.30%, YoY reduction by 63 bps.
- Net NPA down to 0.16%, YoY reduction by 5 bps.
- Provision Coverage Ratio (PCR) stood at 99.31%.
- Return on Assets (ROA) stood at 1.89%, QoQ growth of 14 bps.
- CRAR stood at 26.92%, improved by 153 bps YoY and 27 bps QoQ.
- Credit Deposit Ratio stood at 79.50%, improved by 810 bps YoY and 644 bps QoQ.
Operating Performance for Q1 of FY 2026-27
- Bank has reported Net profit of ₹2,115 crores for Q1 FY 27 as against of ₹2,007 crores for Q1 FY 26. YoY growth of 5% and QoQ growth of 9%.
- Operating Profit stood at ₹2,168 crores.
- Cost of Deposit down to 4.59% in Q1 FY 27 as compared to 4.84% in Q1 FY 26. YoY reduction is by 25 bps and QoQ reduction is by 1 bps.
- Cost of Funds down to 4.68% in Q1 FY 27 as compared to 4.98% in Q1 FY 26. YoY reduction is by 30 bps, QoQ reduction is by 3 bps.
- Net Interest Income (Interest earned less Interest expenses) increased to ₹3,486 crore in Q1 FY 27 as compared to ₹3,166 crore in Q1 FY 26. YoY growth of 10%.
- NIM stood at 3.61%.
- Return on Assets (ROA) stood at 1.89%. QoQ increase by 14 bps.
Business Growth
- Total Deposits increased by 10% YoY to ₹3,25,757 Crore as on June 30, 2026 as against ₹2,96,782 Crore as on June 30, 2025.
- CASA increased by 7% YoY to ₹1,42,162 Crore as on June 30, 2026 as against ₹1,32,467 Crore as on June 30, 2025.
- CASA ratio stood at 43.64% as on June 30, 2026.
- Net Advances grew by 22% YoY to ₹2,58,968 Crore as on June 30, 2026 as against ₹2,11,907 as on June 30, 2025. Net advances grew by 2% QoQ as against ₹2,53,626 as on March 31, 2026.
- The composition of Corporate v/s Retail in Gross Advances portfolio stood at 30:70 as on June 30, 2026.
Asset Quality
- Gross NPA ratio improved to 2.30% as on June 30, 2026 as against 2.93% as on June 30, 2025 and 2.32% as on March 31, 2026.
- Net NPA ratio stood at 0.16% as on June 30, 2026 as against 0.21% as on June 30, 2025.
- Provision Coverage Ratio (including Technical Write-Offs) stood at 99.31% as on June 30, 2026. The PCR is consistently above 99% since September 2023.
Capital Position
- CRAR improved to 26.92% as on June 30, 2026 as against 25.39% as on June 30, 2025 and 26.65% as on March 31, 2026.
- Tier 1 Capital improved to 26.38% as on June 30, 2026 as against 23.71% as on June 30, 2025 and 25.56% as on March 31, 2026.
- Risk Weighted Assets (RWA) stood at ₹2,30,728 Crore as on June 30, 2026 as against ₹1,92,965 Crore as on June 30, 2025.
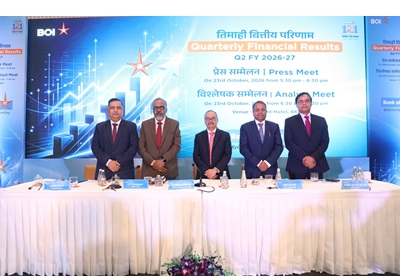
Mumbai: The Board of Directors of IDBI Bank Ltd. (IDBI Bank) met in Mumbai today and approved the financial results for the Quarter ended June 30, 2026.
(₹ crore)
| P&L Highlights | |||||
| (INR in Crores) | Q1 FY 2027 | Q4 FY 2026 | Q1 FY 2026 | Growth % | Growth % |
| (3M) | (3M) | (3M) | Q-o-Q | Y-o-Y | |
| Interest Income | 7541 | 7798 | 7021 | ▼ -3% | ▲ 7% |
| Non-Interest Income | 1032 | 1611 | 1437 | ▼ -36% | ▼ -28% |
| Net Interest Income | 3486 | 3851 | 3166 | ▼ -9% | ▲ 10% |
| Profit/(loss) after Tax | 2115 | 1943 | 2007 | ▲ 9% | ▲ 5% |
| Basic EPS (INR) | 1.97 | 1.81 | 1.87 | ▲ 9% | ▲ 5% |
| Key P&L Ratios | |||||
| Return on Assets¹ | 1.89% | 1.75% | 2.01% | ▲ 14 bps | ▼ -12 bps |
| Return on Equity¹ | 14.80% | 14.35% | 17.91% | ▲ 45 bps | ▼ -311 bps |
| NIM¹ | 3.61% | 4.15% | 3.68% | ▼ -54 bps | ▼ -7 bps |
| Cost to Net Income Ratio | 52.02% | 44.28% | 48.86% | ▲ 774 bps | ▲ 316 bps |
| Cost of Fund | 4.68% | 4.71% | 4.98% | ▼ -3 bps | ▼ -30 bps |
| Cost of Deposit | 4.59% | 4.60% | 4.84% | ▼ -1 bps | ▼ -25 bps |
| Non-Interest Income to Total Income | 12.03% | 17.12% | 16.99% | ▼ -509 bps | ▼ -496 bps |
| Balance Sheet Highlights | |||||
| (INR in Crores) | 30-Jun-26 | 31-Mar-26 | 30-Jun-25 | Growth % | Growth % |
| Net Advances | 2,58,968 | 2,53,626 | 2,11,907 | ▲ 2% | ▲ 22% |
| Deposits | 3,25,757 | 3,47,163 | 2,96,782 | ▼ -6% | ▲ 10% |
| Net Worth | 59,024 | 55,749 | 46,419 | ▲ 6% | ▲ 27% |
| Total Balance Sheet | 4,44,504 | 4,66,560 | 4,03,120 | ▼ -5% | ▲ 10% |
| Total RWA | 2,30,728 | 2,23,246 | 1,92,965 | ▲ 3% | ▲ 20% |
| CASA | 1,42,162 | 1,54,816 | 1,32,467 | ▼ -8% | ▲ 7% |
| Key Balance Sheet Ratios | |||||
| Capital Adequacy | 26.92% | 26.65% | 25.39% | ▲ 27 bps | ▲ 153 bps |
| CET I Ratio | 26.38% | 25.56% | 23.71% | ▲ 82 bps | ▲ 267 bps |
| Gross NPA | 2.30% | 2.32% | 2.93% | ▼ -2 bps | ▼ -63 bps |
| Net NPA | 0.16% | 0.15% | 0.21% | ▲ 1 bps | ▼ -5 bps |
| Provision Coverage ratio | 99.31% | 99.39% | 99.31% | ▼ -8 bps | — 0 bps |
| CASA Ratio | 43.64% | 44.59% | 44.63% | ▼ -95 bps | ▼ -99 bps |
| Credit Deposit Ratio | 79.50% | 73.06% | 71.40% | ▲ 644 bps | ▲ 810 bps |
Previous periods figures have been regrouped/ restated (wherever necessary)
1Annualized




Leave a Reply