
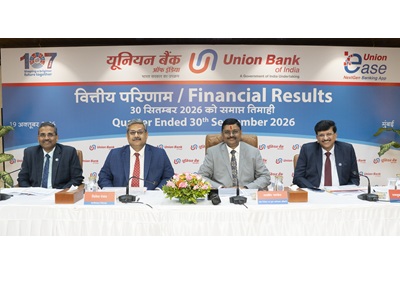
The Board of Directors of Union Bank of India today approved the accounts of the Bank for the Quarter ended September 30, 2026.
1. Financial Performance:
Net Profit of the Bank stood at Rs. 5,537 Crores during Q2FY27. Interest income of Bank stood at Rs. 28,158 Crores during Q2FY27.
2. Business Growth:
Total Business of the Bank increased by 12.01% YoY, wherein Gross Advances increased by 18.53% YoY & Total Deposit grew by 6.87% YoY. Bank has a total Business of Rs. 24,75,330 Crores as on September 30, 2026.
3. Deposit Growth:
Global deposits have increased by 6.87% YoY. Bank now has total deposits base of Rs. 13,19,455 Crores as on September 30, 2026.
4. Growth in Retail, Agri and MSME (RAM) segments:
RAM Segment of the Bank increased by 14.65% YoY, within which 11.24% growth in Retail and 22.39% growth in MSME advances is achieved on YoY basis. RAM advances as a percentage of Domestic Advances stood at 57.47%.
5. Reduction in NPA:
Gross NPA (%) reduced by 87 bps on YoY basis to 2.42% and Net NPA (%) reduced by 13 bps on YoY basis to 0.42% as on 30.09.2026.
6. Strong Capital Ratios:
CRAR stood at 17.94% as on 30.09.2026. CET-1 ratio improved from 14.37% as on 30.09.2025 to 16.05% as on 30.09.2026.
7. Returns:
Bank’s Return on Assets & Return on Equity stands at 1.38% and 17.21% respectively during Q2FY27.
Key Summary of Results
| Particulars | Quarterly | Half Yearly | ||||
| Jun-26 (Q) | Sep-26 (Q) | QoQ (%) / bps | Sep-25 (6M) | Sep-26 (6M) | YoY (%) / bps | |
| Total Business | 23,79,697 | 24,75,330 | 4.02 | 22,09,828 | 24,75,330 | 12.01 |
| Global Deposits | 12,83,366 | 13,19,455 | 2.81 | 12,34,621 | 13,19,455 | 6.87 |
| Current | 73,989 | 81,607 | 10.30 | 63,010 | 81,607 | 29.51 |
| Savings | 3,76,316 | 3,79,121 | 0.75 | 3,38,844 | 3,79,121 | 11.89 |
| CASA | 4,50,305 | 4,60,728 | 2.31 | 4,01,854 | 4,60,728 | 14.65 |
| CASA (%)-Domestic | 35.10 | 34.93 | -17 | 32.56 | 34.93 | 237 |
| CD Ratio (%)-Global | 86.10 | 88.13 | 203 | 79.67 | 88.13 | 846 |
| Retail | 2,56,653 | 2,65,323 | 3.38 | 2,38,506 | 2,65,323 | 11.24 |
| Agriculture | 1,83,184 | 1,89,810 | 3.62 | 1,68,405 | 1,89,810 | 12.71 |
| MSME | 1,68,258 | 1,80,394 | 7.21 | 1,47,395 | 1,80,394 | 22.39 |
| RAM Advances | 6,08,095 | 6,35,527 | 4.51 | 5,54,306 | 6,35,527 | 14.65 |
| Gross Advances | 10,96,331 | 11,55,876 | 5.43 | 9,75,207 | 11,55,876 | 18.53 |
| Earnings | ||||||
| Interest Income | 27,203 | 28,158 | 3.51 | 53,110 | 55,361 | 4.24 |
| Non-Interest Income | 4,603 | 4,651 | 1.04 | 9,482 | 9,254 | -2.40 |
| Interest Expenditure | 17,166 | 17,576 | 2.39 | 35,185 | 34,742 | -1.26 |
| Operating Expenses | 6,638 | 7,126 | 7.36 | 13,684 | 13,764 | 0.58 |
| Net Interest Income | 10,037 | 10,583 | 5.43 | 17,925 | 20,620 | 15.03 |
| Operating Profit | 8,003 | 8,108 | 1.31 | 13,723 | 16,110 | 17.39 |
| Net Profit | 5,332 | 5,537 | 3.84 | 8,365 | 10,870 | 29.95 |
| Ratios | ||||||
| NIM (%) | 2.80 | 2.86 | 6 | 2.71 | 2.83 | 12 |
| Cost of Deposits (%) | 5.05 | 5.01 | -4 | 5.50 | 5.03 | -47 |
| Yield on Advances (%) | 7.90 | 7.90 | 0 | 8.42 | 7.90 | -52 |
| Cost to Income Ratio (%) | 45.34 | 46.78 | 144 | 49.93 | 46.07 | -386 |
| RoA (%) | 1.36 | 1.38 | 2 | 1.13 | 1.37 | 24 |
| RoE (%) | 17.23 | 17.21 | -2 | 14.84 | 16.89 | 205 |
| Gross NPA (%) | 2.65 | 2.42 | -23 | 3.29 | 2.42 | -87 |
| Net NPA (%) | 0.47 | 0.42 | -5 | 0.55 | 0.42 | -13 |
| PCR (%) | 95.05 | 95.20 | 15 | 95.13 | 95.20 | 7 |
| Credit Cost (%) | 0.38 | 0.21 | -17 | 0.34 | 0.29 | -5 |
| CET-1 (%) | 16.38 | 16.05 | -33 | 14.37 | 16.05 | 168 |
| CRAR (%) | 18.46 | 17.94 | -52 | 17.07 | 17.94 | 87 |





Leave a Reply